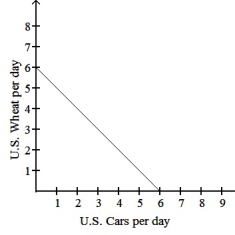
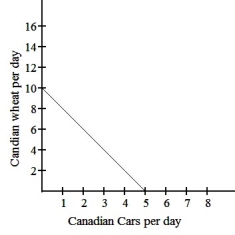
The graphs above show the production possibilities curves for the U.S.and Canada,which both produce cars and wheat.
Based on the graphs above,which of the following is true?
A) The opportunity cost of a car in the U.S. is 1 unit of wheat.
B) The opportunity cost of a car in the U.S. is 5 units of wheat.
C) The opportunity cost of a car in Canada is 1/2 unit of wheat.
D) The opportunity cost of a car in Canada is 2 units of wheat.
Correct Answer:
Verified
Q32: Assume that both the United States and
Q33: Suppose that Sandy can produce 10 economic
Q34: The basis for free trade is the
Q35: In our simple trade model,having a comparative
Unlock this Answer For Free Now!
View this answer and more for free by performing one of the following actions

Scan the QR code to install the App and get 2 free unlocks

Unlock quizzes for free by uploading documents