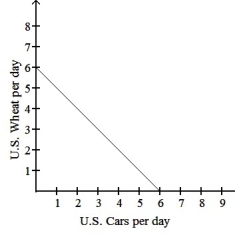
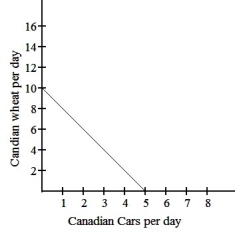
The graphs above show the production possibilities curves for the U.S.and Canada,which both produce cars and wheat.
Determine comparative advantage for each country,and then draw the CPC for each country,assuming that the world price of cars is 1.5 wheat.(Assume that wheat is measured in thousands of bushels.)How would the gains from trade change if the price of cars rose to 1.75 wheat?
Correct Answer:
Verified
View Answer
Unlock this answer now
Get Access to more Verified Answers free of charge
Q18: Table 3.1
Output per Hour Worked

Q19: What did Adam Smith perceive was primarily
Q20: Suppose Mexico can produce 5 autos or
Q21: For a country in autarky,the opportunity cost
Q22: Given that Sandy can produce 10 economics
Q24: Suppose that Paraguay can produce 12 wheat
Q25: Suppose that Canada can produce 15 timber
Q26: Suppose that Canada can produce 15 units
Q27: Given that Sandy can produce 10 economics
Q28: Assume that both the United States and
Unlock this Answer For Free Now!
View this answer and more for free by performing one of the following actions

Scan the QR code to install the App and get 2 free unlocks

Unlock quizzes for free by uploading documents