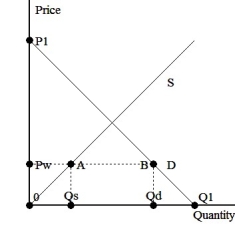
The graph above shows a small country that can import at the world price of Pw and currently imports (Qd-Qs).Suppose that the government imposes quota of 80% of the current import amount (and suppose that this does not raise the domestic price so much that there will be no trade).
Use the graph above to illustrate the effects of the quota.Show the new areas of consumer surplus,producer surplus,and any other relevant areas,and the deadweight losses due to the quota.Who wins and who loses from the tariff?
Correct Answer:
Verified
View Answer
Unlock this answer now
Get Access to more Verified Answers free of charge
Q57: Both tariffs and quotas lead to a
Q58: What do developing countries want regarding agriculture
Q59: Which of the following is FALSE?
A)At the
Q60: A real cost of tariffs and quotas
Q61: If politicians decide to proceed with protection,why
Q63: What is the name of the agreement
Q64: Describe intellectual property rights.What agreements have been
Q65: Give an example of an industry that
Q66: When did intellectual property rights become part
Q67: Internationally,the TRIPS agreement is uniformly regarded as
Unlock this Answer For Free Now!
View this answer and more for free by performing one of the following actions

Scan the QR code to install the App and get 2 free unlocks

Unlock quizzes for free by uploading documents