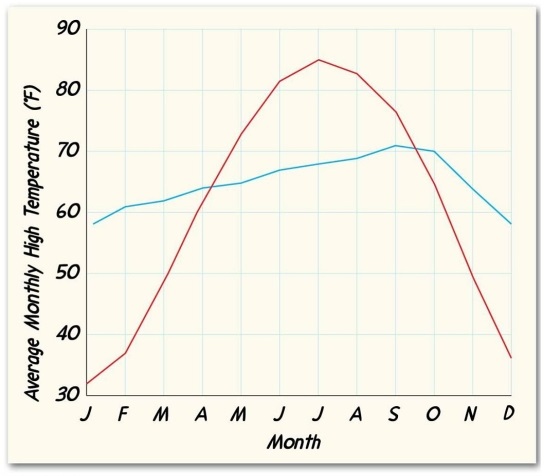
On this graph, one of the monthly mean temperature lines (red or blue)represents the coastal city of San Francisco, California. The other represents Urbana, Illinois, a city on the same latitude as San Francisco, but located deep in the interior of the North American continent. The red line therefore most likely represents ________.
Correct Answer:
Verified
Q49: A day of the year when the
Q50: Q51: Q52: Match the items in the first column Q53: The monthly _ temperature is calculated by Q55: Located adjacent to red on the electromagnetic Q56: All places at the same _ have Q57: _ is the most abundant gas in Q58: Carbon dioxide and _ are the most Q59: Explain the discrepancy between someone who looks![]()
![]()
Unlock this Answer For Free Now!
View this answer and more for free by performing one of the following actions

Scan the QR code to install the App and get 2 free unlocks

Unlock quizzes for free by uploading documents