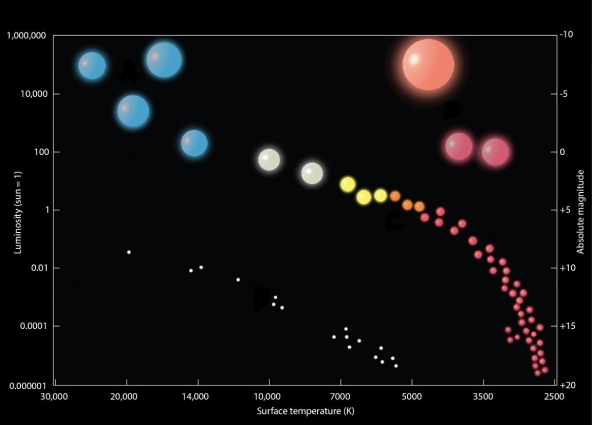
This graph is called a(n)________ showing the relationship of temperature to absolute magnitude for various stars.
Correct Answer:
Verified
View Answer
Unlock this answer now
Get Access to more Verified Answers free of charge
Q38: The measure of a star's brightness is
Q39: The point in stellar evolution when a
Q40: The Milky Way is in a galactic
Q41: The Crab Nebula is a planetary nebula
Q42: The biggest explosions in the universe are
Q44: Observations of the redshift of most galaxies
Q45: Match the types of nebulae in the
Q46: Identify and label each of the different
Q47: When a star is so dense that
Q69: Very large red stars,such as Betelgeuse in
Unlock this Answer For Free Now!
View this answer and more for free by performing one of the following actions

Scan the QR code to install the App and get 2 free unlocks

Unlock quizzes for free by uploading documents