In Figure 3.2, the solid line depicts normal hemoglobin. 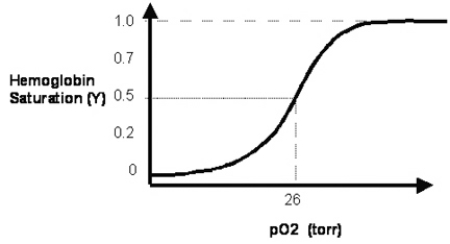 How does the normal curve change when the 2,3-bisphosphoglycerate (2,3-BPG) concentration is reduced?
A) The oxygen half-saturation pressure value P50 of the new hemoglobin saturation curve is reduced.
B) The maximal saturation of hemoglobin with oxygen is reduced to less than a value of 1.0.
C) The oxygen partial pressure (pO₂) at which hemoglobin attains a Y-axis value of 0.25 is increased.
D) The new curve has a Y-axis value of 0.25 at a pO₂ of 26 mm Hg.
E) The new curve has a reduced slope at the P50 value of 26 mm Hg.
Correct Answer:
Verified
Q1: Fetal hemoglobin has a somewhat higher oxygen-binding
Q2: The quaternary structure of deoxyhemoglobin is maintained,
Q3: The effect of high 2,3-BPG in red
Q4: An experienced hiker, H.A., spends her vacation
Q5: A solution of equal amounts of hemoglobin
Q7: Which of the following statements about hemoglobin
Q8: The oxygen dissociation curve of hemoglobin is
Q9: A 26-year-old scuba diver returns after a
Q10: Most of the carbon dioxide that is
Unlock this Answer For Free Now!
View this answer and more for free by performing one of the following actions

Scan the QR code to install the App and get 2 free unlocks

Unlock quizzes for free by uploading documents