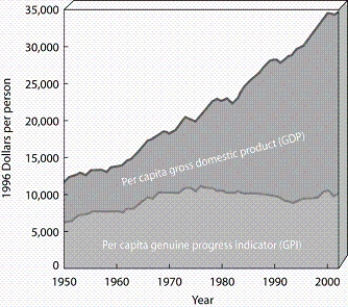
-According to the diagram, what was the approximate percentage change in the GDP between 1990 and 2000?
Correct Answer:
Verified
Q45: _ prove that individuals matter and can
Q47: A(n)_ neither depletes natural resources nor pollutes
Q55: Environmentally harmful,or _,businesses are those that are
Q64: _ is the increase in total cost
Q66: What is meant by the optimum level
Q67: Environmentalists think that _ can encourage companies
Q68: _ has numerous harmful health and environmental
Q70: In simple terms,_ include production and consumption.
Q89: In order to implement _, governments should
Q131: A(n)_ includes the harmful indirect or direct
Unlock this Answer For Free Now!
View this answer and more for free by performing one of the following actions

Scan the QR code to install the App and get 2 free unlocks

Unlock quizzes for free by uploading documents