After reading the paragraph below, answer the questions that follow.
The graph below shows records of temperature (light gray line) and CO₂ (dark gray line) over the past 1,000 years. CO₂ is recorded in parts per million (ppm) .
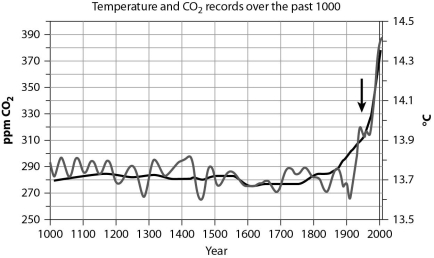
-If you focus on the data from the mid-1900s (indicated by the arrow) through today, the graph shows that
A) there is a correlation between CO₂ and temperature; when CO₂ levels are high, so is temperature.
B) there is a correlation between CO₂ and temperature; when CO₂ levels are high, temperature is low.
C) there is no correlation between CO₂ and temperature; CO₂ fluctuates randomly and temperature is constant.
D) there is no correlation between CO₂ and temperature; CO₂ is constant and temperature fluctuates randomly.
Correct Answer:
Verified
Q44: In photosynthesis, the chemiosmotic production of ATP
A)
Q51: Global warming due to the greenhouse effect
Q55: Mitochondria transfer _ energy from _ to
Q61: According to this figure, how do hydrogen
Q62: After reading the paragraph below, answer the
Q64: After reading the paragraph below, answer the
Q65: It has been suggested that global warming
Q66: Purple sulfur bacteria are organisms capable of
Q67: Atrazine is a widely used herbicide that
Q68: Put the following steps of the Calvin
Unlock this Answer For Free Now!
View this answer and more for free by performing one of the following actions

Scan the QR code to install the App and get 2 free unlocks

Unlock quizzes for free by uploading documents