The figure below depicts natural fluctuation of ozone levels in Switzerland between 1925 and 1976. Dobson units are a way to measure the total amount of atmospheric ozone above a point on the Earth's surface. 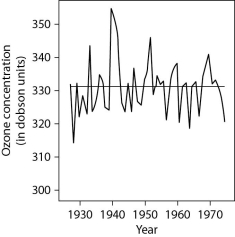
What can you conclude from this figure?
A) Natural fluctuation of ozone levels varies greatly year to year, so the average for this 50-year span was approximately 330 Dobson units.
B) Switzerland can be used as a model example of how to maintain safe ozone levels.
C) All small European countries will show fluctuations in ozone concentration levels.
D) Ozone levels show a distinct pattern of increasing by 10 Dobson units every 10 years.
Correct Answer:
Verified
Q27: Protecting the endangered black-footed ferret from extinction
Q41: After reading the paragraph below, answer the
Q42: According to this figure, which organisms have
Q43: You are a climate scientist who wants
Q44: While habitat destruction by humans creates fragmented
Q46: After reading the paragraph below, answer the
Q48: Which of the following is not an
Q49: Suppose a species of wild boar (a
Q50: After reading the paragraphs below, answer the
Q56: In Clackamas, Oregon, a stand of hybrid
Unlock this Answer For Free Now!
View this answer and more for free by performing one of the following actions

Scan the QR code to install the App and get 2 free unlocks

Unlock quizzes for free by uploading documents