Short Answer

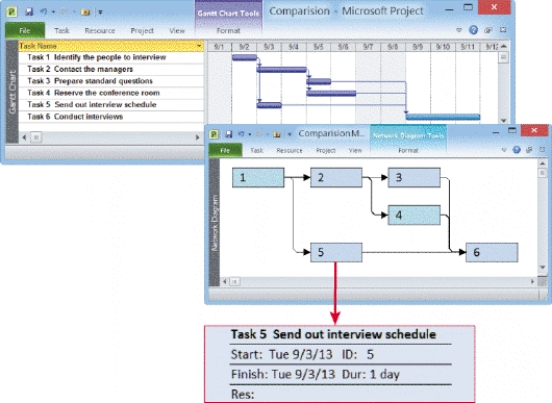
-The PERT chart called a network diagram in the accompanying figure represents a bottom-up technique, because it analyzes a large, complex project as a series of individual ____________________.
Correct Answer:
Verified
Related Questions

