Consider the following diagram,and then answer the question below.
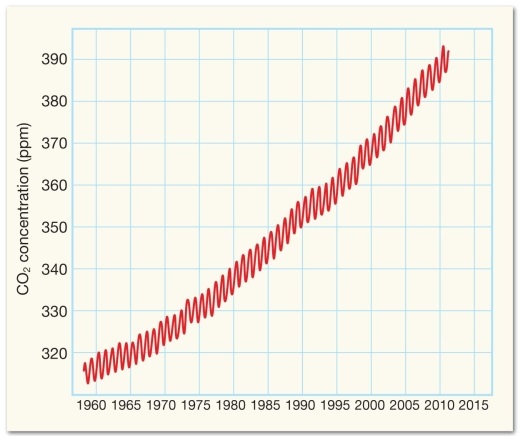
-What best explains the "bumps" seen in the seen in the CO₂ concentrations on the graph above?
A) greater amounts of CO₂ released by the burning of fossil fuels for heat during the winter
B) higher levels of traffic producing more CO₂ during the summer travel season
C) changes in plant growth that result in less CO₂ being absorbed during the dormant season
D) a cyclic pattern in the eruption of volcanoes,causing more CO₂ to be released each spring
Correct Answer:
Verified
Q25: The formation of fossil fuels begins when:
A)dormant
Q26: Dust and aerosols in the atmosphere are
Q27: Which of the following is the MOST
Q28: Which of the following is NOT a
Q29: Water vapor represents what fraction of the
Q31: Studies have shown that on average ozone
Q32: This atmospheric component absorbs damaging ultraviolet radiation
Q33: The ozone layer is found in the:
A)thermosphere.
B)stratosphere.
C)troposphere.
D)mesosphere.
E)ionosphere.
Q34: Scientists believe that a growing amount of
Q35: Which of these was NOT involved with
Unlock this Answer For Free Now!
View this answer and more for free by performing one of the following actions

Scan the QR code to install the App and get 2 free unlocks

Unlock quizzes for free by uploading documents