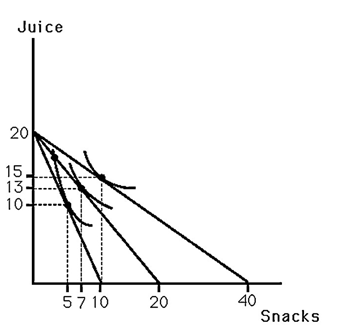
-The above figure shows Bobby's indifference map for juice and snacks.Also shown are three budget lines resulting from different prices for snacks assuming he has $20 to spend on these goods.What is MRS for the point on Bobby's demand curve for snacks where price of snacks is $0.5?
A) -1
B) -0.5
C) -2
D) Not enough information
Correct Answer:
Verified
Q2: Use the Slutsky equation to show that
Q5: Q6: In the relevant price range a demand Q7: An increase in the price of a Q9: Q12: An individual's demand curve for a good Q13: Draw two graphs,one directly above the other.On Unlock this Answer For Free Now! View this answer and more for free by performing one of the following actions Scan the QR code to install the App and get 2 free unlocks Unlock quizzes for free by uploading documents![]()
![]()

