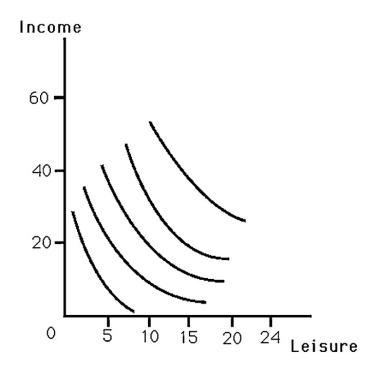
-The above figure shows an indifference map for a person's choices between leisure and consumption.Derive this person's labor supply curve for wage rates of $5,$10,and $15.
Correct Answer:
Verified
View Answer
Unlock this answer now
Get Access to more Verified Answers free of charge
Q59: A backward-bending labor supply curve could possibly
Q61: The graph below shows George's indifference curves
Q65: If the marginal tax rate rises above
Q69: What does it mean to say the
Q91: If a person supplies more hours of
Q104: An increase in unearned income always creates
Q108: In response to an increase in the
Q112: In response to an increase in the
Q115: A tax cut will unambiguously lower income-tax
Q116: Suppose a person's utility for leisure (L)and
Unlock this Answer For Free Now!
View this answer and more for free by performing one of the following actions

Scan the QR code to install the App and get 2 free unlocks

Unlock quizzes for free by uploading documents