Multiple Choice
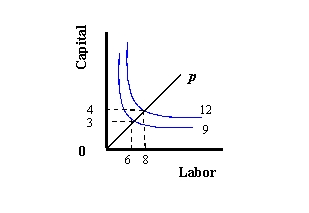
Exhibit 8-1
(a)
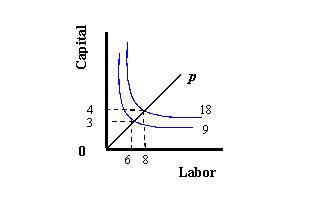
(b)
(c)

-Refer to Exhibit 8-1. Which graph depicts increasing returns to scale?
A) (a)
B) (b)
C) (c)
Correct Answer:
Verified
Related Questions
Q21: The increase in the amount of output
Q22: Exhibit 8-1 Q23: A period of time long enough to Q24: An example of a total product curve
(a)
![]()
Unlock this Answer For Free Now!
View this answer and more for free by performing one of the following actions

Scan the QR code to install the App and get 2 free unlocks

Unlock quizzes for free by uploading documents