Multiple Choice
Exhibit 8-1
(a)
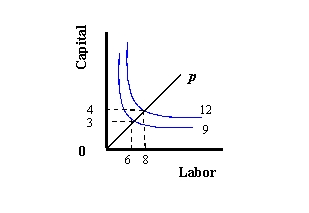
(b)
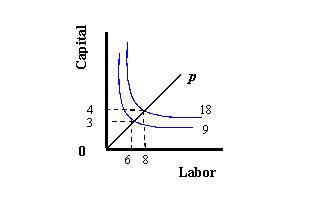
(c)

-Refer to Exhibit 8-1. Which graph depicts decreasing returns to scale?
A) (a)
B) (b)
C) (c)
Correct Answer:
Verified
Related Questions
Q17: The marginal product curve represents how much
Q18: Technology is
A) the set of constraints on
Q19: Opportunity cost is measured by the amount
Q20: The amount by which output would increase
Q21: The increase in the amount of output
Q23: A period of time long enough to
Q24: An example of a total product curve
Unlock this Answer For Free Now!
View this answer and more for free by performing one of the following actions

Scan the QR code to install the App and get 2 free unlocks

Unlock quizzes for free by uploading documents