Multiple Choice
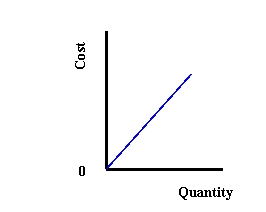
(a)
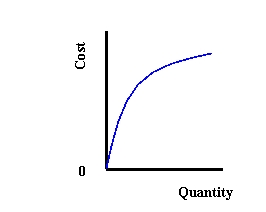
(b)
(c)
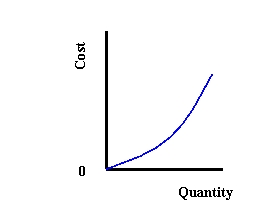
-Refer to Exhibit 9-3. Which graphs shows a cost function for a Cobb-Douglas production function with constant returns to scale?
A) (a)
B) (b)
C) (c)
Correct Answer:
Verified
Related Questions
Q22: With a Cobb-Douglas technology, when α+ β=
Q22: With a Cobb-Douglas technology, when α+ β=
Q29: What is the difference between finding the
Q30: How does a producer choose the optimal
Q32: Describe the reasons for input substitution.
Q33: If capital becomes very expensive and labor
Q35: In the equation y
Unlock this Answer For Free Now!
View this answer and more for free by performing one of the following actions

Scan the QR code to install the App and get 2 free unlocks

Unlock quizzes for free by uploading documents