Multiple Choice
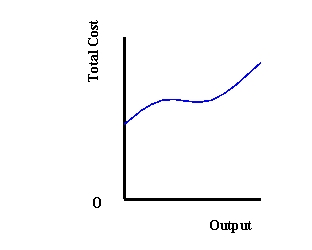
-Refer to Exhibit 10-2. This graph most likely illustrates a short-run
A) total cost function
B) production function
C) average cost function
Correct Answer:
Verified
Related Questions
Q2: The short-run total cost function describes the
Q3: The short-run average fixed cost function gives
Q4: Costs that change with the level of
Q5: A function describing the marginal cost of
Q6: A short-run total _ function can be
Q8: When an entrepreneur produces only a few
Q9: The long-run total cost function describes the
Unlock this Answer For Free Now!
View this answer and more for free by performing one of the following actions

Scan the QR code to install the App and get 2 free unlocks

Unlock quizzes for free by uploading documents