Figure 9-4
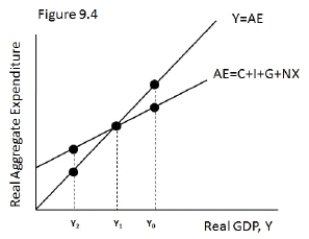
-Refer to Figure 9-4.Which of the following best describes the relationship between output and desired spending at Y₀?
A) Output is less than desired spending, and inventories will fall.
B) Output is greater than desired spending, and inventories will rise.
C) Output is less than desired spending, and governments must decrease spending.
D) Output is greater than desired spending, and real wealth will fall.
Correct Answer:
Verified
Q30: The SRAS curve is vertical at the
Q34: A change that shifted the long-run aggregate
Q46: When the price level rises as a
Q145: Increases in government regulations can make it
Q147: Both short-run and long-run aggregate supply curves
Q148: If the current price of steel rises
Q151: If there is currently an expansionary gap,an
Q152: The quantity of real GDP supplied will
Q153: The long-run level of real GDP changes
Q155: Figure 9-4
![]()
Unlock this Answer For Free Now!
View this answer and more for free by performing one of the following actions

Scan the QR code to install the App and get 2 free unlocks

Unlock quizzes for free by uploading documents