Multiple Choice
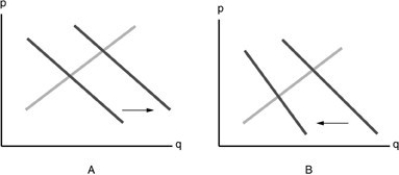
-Refer to the above figure. Suppose that Cheerios and Apple Jacks are substitutes. Which diagram shows the effect on the demand for Cheerios when the price of Apple Jacks cereal has decreased?
A) A
B) B
C) neither graph
D) both graphs
Correct Answer:
Verified
Related Questions

