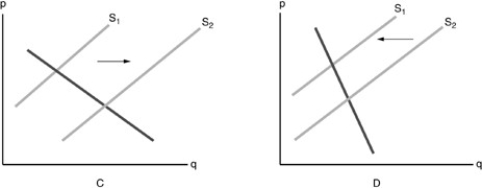
-Refer to the above figure. Which diagram shows the effect on the market of Corn Flakes when the demand for Corn Flakes has increased?
A) graph C
B) graph D
C) neither graph
D) both graphs
Correct Answer:
Verified
Q322: The imposition of a per unit tax
Q326: Which of the following will NOT cause
Q328: Which of the following will shift the
Q330: Which of the following would likely cause
Q332: Which of the following will cause a
Q333: Q337: Which of the following is a non-price Q337: Which of the following will NOT affect Q338: A subsidy to carrot farmers will Q340: ![]()
A)increase the![]()
Unlock this Answer For Free Now!
View this answer and more for free by performing one of the following actions

Scan the QR code to install the App and get 2 free unlocks

Unlock quizzes for free by uploading documents