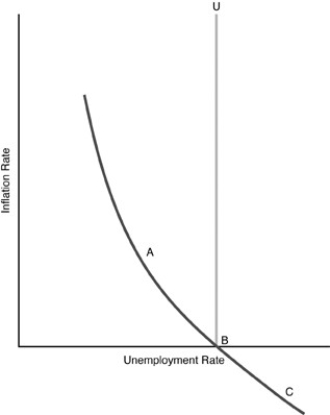
-In the above figure, what does the line U represent?
A) the Phillips curve
B) the natural rate of Unemployment
C) potential unemployment
D) full inflation rate of unemployment
Correct Answer:
Verified
Q111: Q112: An unexpected decrease in aggregate demand Q115: The historical record suggests that Q116: The downward slope of the Phillips curve Q116: An unexpected increase in aggregate demand Q117: According to the Phillips curve Q121: According to the rational expectations hypothesis, an Q123: The hypothesis stating that people combine the Q129: Suppose the economy has been experiencing zero Q140: A trade-off between unemployment and inflation is![]()
A) causes
A)the Phillips curve
A)causes the
A) there is
Unlock this Answer For Free Now!
View this answer and more for free by performing one of the following actions

Scan the QR code to install the App and get 2 free unlocks

Unlock quizzes for free by uploading documents