According to the figure below,at the price of $5: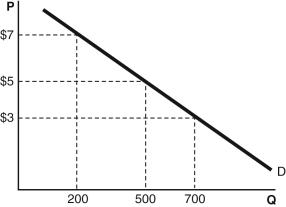
A) the equilibrium quantity is 500.
B) the quantity demanded is 500.
C) the demand is 500.
D) there is a surplus.
E) there is a shortage.
Correct Answer:
Verified
Q6: A demand schedule
A) is a curve representing
Q11: Refer to the table below. Q12: Consider the following demand schedules for New Q16: When the price of an hour of Q17: In March 2012,the state of California started Q18: The price of good X increases by Q19: If the price of a good increases,holding Q29: Something is an inferior good if the Q39: Which of the following would cause a Q113: A decrease in demand is represented by![]()
Unlock this Answer For Free Now!
View this answer and more for free by performing one of the following actions

Scan the QR code to install the App and get 2 free unlocks

Unlock quizzes for free by uploading documents