Refer to the following figure to answer the questions that follow.
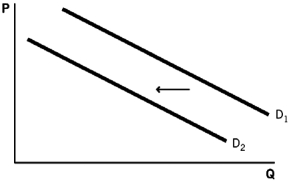
-Which of the following scenarios would explain the change in equilibrium shown in the figure?
A) an increase in an input price
B) a decrease in the number of buyers in a market
C) an increase in the price of a substitute good
D) an increase in the expected future price
E) a negative technological change
Correct Answer:
Verified
Q16: When the price of an hour of
Q17: In March 2012,the state of California started
Q18: The price of good X increases by
Q19: If the price of a good increases,holding
Q22: As more people migrated West during the
Q23: Assume there are 100 suppliers of widgets
Q24: Which of the following will cause a
Q26: Chuck drives past the same gas station
Q30: An expectation of a lower price in
Q37: Which of the following would cause the
Unlock this Answer For Free Now!
View this answer and more for free by performing one of the following actions

Scan the QR code to install the App and get 2 free unlocks

Unlock quizzes for free by uploading documents