The change in equilibrium shown in the accompanying figure would be explained by a(n) ________ in the price of an input and a(n) ________ in the price of a ________.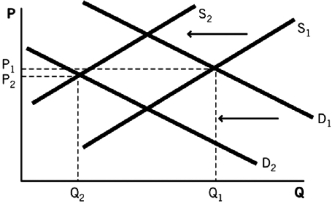
A) increase; increase; complement
B) decrease; increase; complement
C) decrease; increase; substitute
D) increase; decrease; complement
E) increase; increase; substitute
Correct Answer:
Verified
Q12: Price elasticity of demand measures the change
Q27: If a business finds that demand for
Q106: When people move to an area of
Q108: Refer to the table below.The equilibrium price
Q110: If your friend says,"I am never going
Q111: Refer to the table below.If the price
Q136: What would happen to the equilibrium price
Q140: Many consumer items eventually go out of
Q144: Shoes are considered to be a normal
Q152: In agriculture,a "bumper crop" refers to a
Unlock this Answer For Free Now!
View this answer and more for free by performing one of the following actions

Scan the QR code to install the App and get 2 free unlocks

Unlock quizzes for free by uploading documents