Refer to the accompanying figure.Which area represents the difference between the social supply curve and the internal supply curve associated with producing at the market equilibrium instead of the social optimum?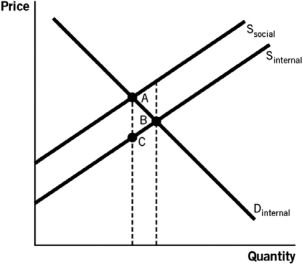
A) A
B) B
C) A + B
D) C
E) A + B + C
Correct Answer:
Verified
Q36: If government regulation forces firms in an
Q44: If the government decides to adopt a
Q89: Refer to the accompanying table,where Q represents
Q91: Consider the market for refined oil.In the
Q93: Consider a market where production of the
Q95: To reduce the level of pollution emitted
Q96: Which of the following is a benefit
Q97: Which of the following is a cost
Q98: Consider the accompanying figure to answer the
Q99: Refer to the accompanying table,where Q represents
Unlock this Answer For Free Now!
View this answer and more for free by performing one of the following actions

Scan the QR code to install the App and get 2 free unlocks

Unlock quizzes for free by uploading documents