Use the following graph to answer the following questions.This graph depicts an economy where aggregate demand has decreased,with no change in either short-run aggregate supply (SRAS) or long-run aggregate supply (LRAS) .
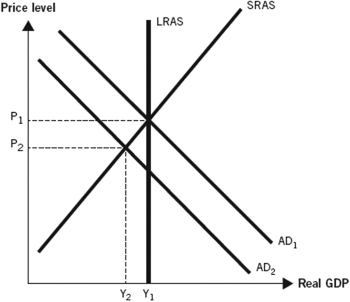
-The graph accurately summarizes what happened during the Great Depression,because during that time,the price level ________ and real gross domestic product (GDP) ________.
A) decreased; decreased
B) increased; decreased
C) remained unchanged; remained unchanged
D) decreased; increased
E) remained unchanged; decreased
Correct Answer:
Verified
Q65: As a result of several factors,aggregate demand
Q66: Use the following graph to answer the
Q67: Which of the following would have caused
Q68: During the Great Depression,the U.S.aggregate demand curve
Q69: During the Great Depression,the U.S.aggregate demand curve
Q71: Use the following graph to answer the
Q72: Prior to the Great Depression,U.S.stock prices decreased
Q73: During the Great Depression,aggregate demand decreased.This would
Q74: During the Great Depression,the U.S.aggregate demand curve
Q75: During the Great Depression,thousands of U.S.banks failed.As
Unlock this Answer For Free Now!
View this answer and more for free by performing one of the following actions

Scan the QR code to install the App and get 2 free unlocks

Unlock quizzes for free by uploading documents