Refer to the following graph to answer the questions that follow.
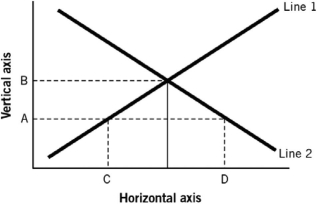
-Assuming the figure represents the market for loanable funds,it would be true that:
A) line 1 represents savings (supply) , and line 2 represents investment (demand) .
B) the vertical axis represents the interest rate, and the distance between points C and D represents the surplus of loanable funds at interest rate A.
C) line 1 represents investment demand, and line 2 represents savings.
D) the vertical axis represents the quantity of funds loaned and borrowed, whereas the distance between points C and D represents the shortage of loanable funds at interest rate A.
E) line 1 represents the interest rate, and line 2 represents the quantity of savings.
Correct Answer:
Verified
Q83: The notion of consumption smoothing means:
A) people
Q84: Most people have a time preference.Since this
Q89: Based on the relationship between consumption and
Q95: When people withdraw funds from their savings,economists
Q106: One argument that is made concerning the
Q107: An increase in the supply of loanable
Q111: One could correctly argue that higher capital
Q115: The measurement of personal savings may be
Q116: Equilibrium in the loanable funds market means
Q118: Firms expect more sales and profits in
Unlock this Answer For Free Now!
View this answer and more for free by performing one of the following actions

Scan the QR code to install the App and get 2 free unlocks

Unlock quizzes for free by uploading documents