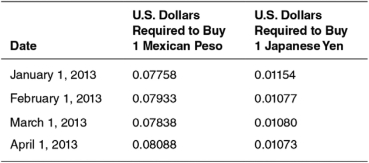
The following table shows the number of U.S. dollars required to buy one Mexican peso and the number of U.S. dollars required to buy one Japanese yen between January 1, 2013, and April 1, 2013. Use this table to answer the questions that follow.
-Between January 1,2013,and February 1,2013,the number of:
A) Japanese goods exported to the United States likely decreased because Japanese goods became more expensive to consumers in the United States.
B) U.S.goods exported to Japan likely decreased because U.S.goods became less expensive to consumers in Japan.
C) Mexican goods exported to the United States likely increased because the Mexican peso depreciated against the U.S.dollar.
D) U.S.goods exported to Mexico likely did not change because the Mexican peso is pegged to the Japanese yen, but not to the U.S.dollar.
E) Japanese goods exported to the United States likely increased because Japanese goods became less expensive to consumers in the United States.
Correct Answer:
Verified
Q22: According to the law of _,the quantity
Q26: The claim that the quantity of euros
Q33: If interest rates fall in the United
Q77: The national government or central bank of
Q112: The following table shows the number of
Q113: The following table shows the number of
Q118: The following table shows the number of
Q119: The following table shows the number of
Q120: The arrows in Figures A-D represent possible
Q122: The following table shows the number of
Unlock this Answer For Free Now!
View this answer and more for free by performing one of the following actions

Scan the QR code to install the App and get 2 free unlocks

Unlock quizzes for free by uploading documents