Refer to the accompanying diagram.Which of the following scenarios would explain this change in equilibrium?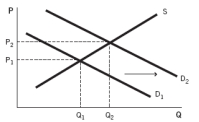
A) A number of firms left the market.
B) A number of buyers entered the market, and a number of firms entered the market.
C) The price of a complement of this good increased.
D) The price of a substitute of this good increased.
E) The price of this good decreased.
Correct Answer:
Verified
Q69: When the demand curve shifts to the
Q75: According to the accompanying figure,if the price
Q78: When the demand curve shifts to the
Q78: When supply shifts to the right and
Q79: The equilibrium price of peanut butter is
Q82: A shortage occurs whenever
A) the quantity supplied
Q86: The economists at JET Consulting consider Campbell's
Q89: Wine and cheese are complement goods because
Q101: A technological advancement for Good A will
Q113: A decrease in demand is represented by
Unlock this Answer For Free Now!
View this answer and more for free by performing one of the following actions

Scan the QR code to install the App and get 2 free unlocks

Unlock quizzes for free by uploading documents