The change in equilibrium shown in the accompanying figure would be explained by a(n) :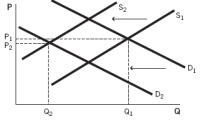
A) increase in the price of an input and an increase in the price of a complement.
B) decrease in the price of an input and an increase in the price of a complement.
C) decrease in the price of an input and an increase the in price of a substitute.
D) increase in the price of an input and a decrease in the price of a complement.
E) increase in the price of an input and a increase in the price of a substitute.
Correct Answer:
Verified
Q84: What would you expect to happen to
Q96: What would you expect to happen to
Q104: The government offers numerous educational subsidies through
Q106: When supply shifts left and demand shifts
Q140: Many consumer items eventually go out of
Q142: Assume that the price of rubber increased
Q144: Shoes are considered to be a normal
Q147: What happens to the equilibrium price and
Q152: In agriculture,a "bumper crop" refers to a
Q153: Compare and contrast the differences between a
Unlock this Answer For Free Now!
View this answer and more for free by performing one of the following actions

Scan the QR code to install the App and get 2 free unlocks

Unlock quizzes for free by uploading documents