Refer to the following graph to answer the next five questions:
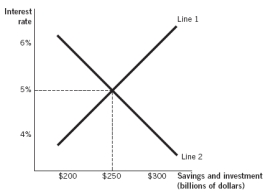
-In the figure,line 2 represents ____________,and at an interest rate of 6% ____________ exists.
A) the supply of loanable funds; a shortage of loanable funds
B) the quantity demanded of loanable funds; a surplus of loanable funds
C) the demand for loanable funds; a shortage of loanable funds
D) the quantity supplied of loanable funds; a surplus of loanable funds
E) the demand of loanable funds; a surplus of loanable funds
Correct Answer:
Verified
Q2: The interest rate is
A) the price of
Q8: Foreign entities
A) are generally borrowers of domestic
Q10: The supply of loanable funds comes from
A)
Q11: Every dollar borrowed
A) represents a dollar leaving
Q14: The notion of the loanable funds market
Q15: The correct production timeline is
A) investment occurs,dollars
Q16: Savings represents
A) the demand for loanable funds.
B)
Q21: Two nations are located next to one
Q26: The government engages in more deficit spending.Ceteris
Q35: An interest rate best represents _ to
Unlock this Answer For Free Now!
View this answer and more for free by performing one of the following actions

Scan the QR code to install the App and get 2 free unlocks

Unlock quizzes for free by uploading documents