Which of the following diagrams represents a Laffer curve?
A) 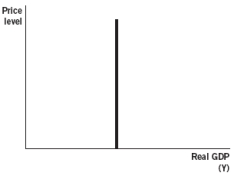
B) 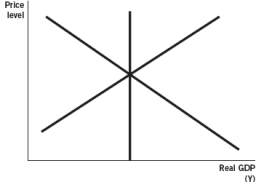
C) 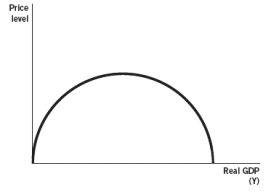
D) 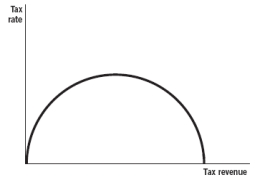
E) 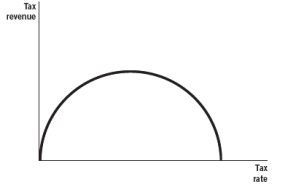
Correct Answer:
Verified
Q83: Lower corporate profit tax rates
A) will always
Q96: The assertion that increases in government spending
Q98: Lowering marginal income tax rates for individuals
A)
Q100: Depending on how fiscal policy is implemented,it
Q103: In 1962,the marginal tax rates were as
Q105: Politicians who always advocate for tax rate
Q106: Considering all U.S.taxpayers,average tax revenue (adjusted for
Q107: Supply-side fiscal policy initiatives take a long
Q119: At _ tax rates,_ in those tax
Q130: Which of the following is an example
Unlock this Answer For Free Now!
View this answer and more for free by performing one of the following actions

Scan the QR code to install the App and get 2 free unlocks

Unlock quizzes for free by uploading documents