Multiple Choice
Figure 10.5.1 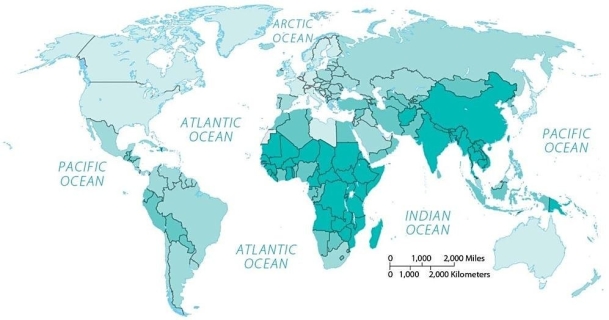
-If darker shades indicate higher values,this is likely a map of
A) percent labor force engaged in agriculture.
B) tractors per area of farmland.
C) population density.
D) food surpluses by region.
E) economic development.
Correct Answer:
Verified
Related Questions
Q22: Geographer Derwent Whittlesey identified 11 main agricultural
Q23: The most important distinction for dividing the
Q24: Which is not a form of subsistence
Q25: Which type of agriculture is found primarily
Unlock this Answer For Free Now!
View this answer and more for free by performing one of the following actions

Scan the QR code to install the App and get 2 free unlocks

Unlock quizzes for free by uploading documents