Figure 10.9.1 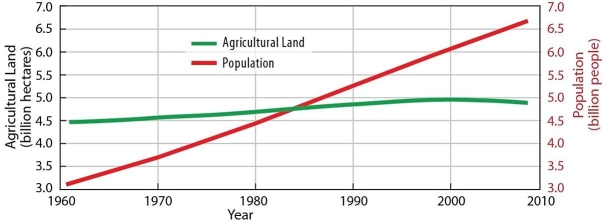
-This figure helps to explain that for the last half century most increase in food production has come from
A) expanding agricultural land.
B) expanding exports.
C) discovering new foods.
D) increasing agricultural productivity.
E) increasing fish harvests.
Correct Answer:
Verified
Q38: Shifting cultivation is being replaced by
A) logging.
B)
Q39: Which of the following is not an
Q40: Which of the following has aided 20th
Q42: The agricultural practice most dependent on being
Q44: The world leader in land area devoted
Q45: Which of the following is not a
Unlock this Answer For Free Now!
View this answer and more for free by performing one of the following actions

Scan the QR code to install the App and get 2 free unlocks

Unlock quizzes for free by uploading documents