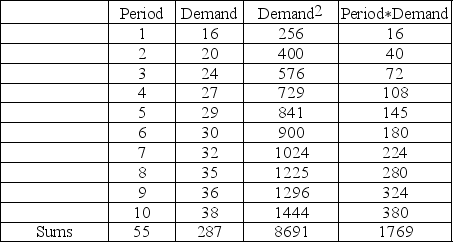
Using the data shown in the table,develop a trend line that can be used to predict the demand for time period number 20.What is the prediction equation and what is your forecast for period 20?
Correct Answer:
Verified
=
=
= 2.3
=
-
...
View Answer
Unlock this answer now
Get Access to more Verified Answers free of charge
Q10: Describe the mechanics of three qualitative forecasting
Q14: What are the laws of forecasting and
Q32: Dividing actual demand by the model's forecast
Q46: Examine these two graphs and based on
Q47: Multiple regression was used to forecast success
Q49: A forecaster is assessing two different models
Q50: The Pancake House did a brisk business
Q54: What is a collaborative planning,forecasting,and replenishment system
Q65: In order to indicate _ in a
Q67: A tracking signal value between _ and
Unlock this Answer For Free Now!
View this answer and more for free by performing one of the following actions

Scan the QR code to install the App and get 2 free unlocks

Unlock quizzes for free by uploading documents