This graph of expected sales level and expected output shows: 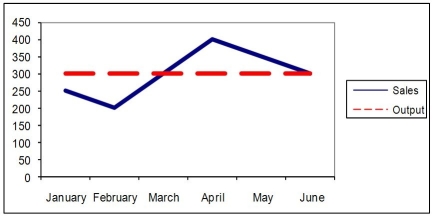
A) a chase production plan is being used.
B) a level production plan is being used.
C) a mixed production plan is being used.
D) planning levels have been computed.
Correct Answer:
Verified
Q24: Forty percent of a house painter's business
Q28: There are few,if any,options for adjusting capacity
Q30: It costs $10 to make a single
Q33: A production planner can confirm future capacity
Q36: A company has a sales forecast for
Q36: The standard equation used by Gigi Enterprises
Q47: In order for _ planning to work,
Q53: A(n)_ production plan matches production in each
Q55: A major retailer has recently deployed self-checkout
Q57: A sales and operations plan that varies
Unlock this Answer For Free Now!
View this answer and more for free by performing one of the following actions

Scan the QR code to install the App and get 2 free unlocks

Unlock quizzes for free by uploading documents