Figure 5.7 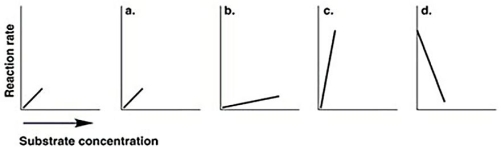
-The graph at the left in Figure 5.7 shows the reaction rate for an enzyme at its optimum temperature.Which graph shows enzyme activity at a higher temperature?
A) a
B) b
C) c
D) d
Correct Answer:
Verified
Q18: What is the fate of pyruvic acid
Q19: Which of the following is the best
Q20: Figure 5.4 Q21: Which of the following uses glucose for Q22: If a cell is starved for ATP,which Q24: An enzyme,citrate synthase,in the Krebs cycle is Q25: In green and purple bacteria,electrons to reduce Q26: Which of the following statements are TRUE? Q27: Assume you are working for a chemical Q28: Which of the following statements regarding the![]()
1-Electron
Unlock this Answer For Free Now!
View this answer and more for free by performing one of the following actions

Scan the QR code to install the App and get 2 free unlocks

Unlock quizzes for free by uploading documents