Figure 6.2
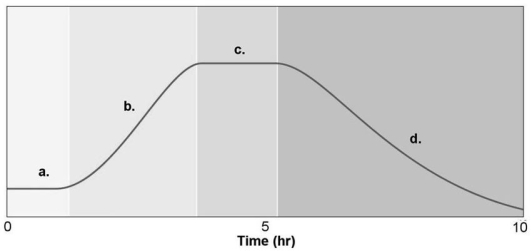
-Figure 6.2 shows a typical bacterial growth curve with the y-axis indicating the log of the number of bacteria and the x-axis indicating time in culture.In the figure,which sections of the graph illustrate a logarithmic change in cell numbers?
A) a and c
B) b and d
C) a and b
D) c and d
E) a and d
Correct Answer:
Verified
Q6: Which of the following is an advantage
Q7: The term aerotolerant anaerobe refers to an
Q8: Figure 6.1 Q9: Figure 6.1 Q10: Salts and sugars work to preserve foods Q12: Pathogenic bacteria isolated from the respiratory or Q13: If cells are grown in media containing Q14: Which of the following elements is NOT Q15: Figure 6.1 Q16: Figure 6.1 Unlock this Answer For Free Now! View this answer and more for free by performing one of the following actions Scan the QR code to install the App and get 2 free unlocks Unlock quizzes for free by uploading documents
![]()
![]()
![]()
![]()

