Refer to Figure 14.2
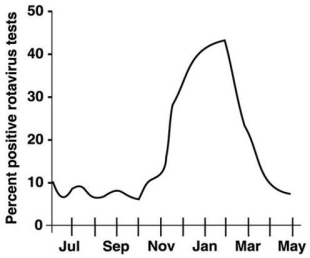
-In Figure 14.2,when is the prevalence the highest?
A) July
B) January
C) February
D) March
Correct Answer:
Verified
Q24: Which of the following can contribute to
Q25: Which of the following is NOT a
Q26: Refer to figure 14.1 Q27: Which of the following pairs is mismatched? Q28: Symptoms of disease differ from signs of Q30: A disease in which the causative agent Q31: Would you expect the graph to change Q32: The CDC is located in Q33: The science that deals with when diseases Q34: Situation 14.1
![]()
A)malaria
A)Atlanta,GA.
B)Washington,DC.
C)New York City,NY.
D)Los
During a six-month period, 239 cases
Unlock this Answer For Free Now!
View this answer and more for free by performing one of the following actions

Scan the QR code to install the App and get 2 free unlocks

Unlock quizzes for free by uploading documents