THE NEXT QUESTIONS ARE BASED ON THE FOLLOWING INFORMATION:
A professor of statistics is interested in studying the relationship between the number of hours graduate students spent studying for his comprehensive final exam and the exam score.The results of the regression analysis of hours studied on exam scores are presented below. 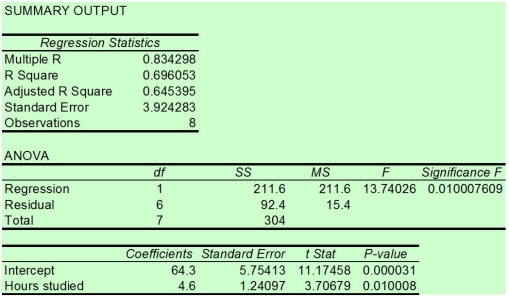
-Which of the following is used to plot the dependent variable versus the independent variable?
A) a histogram
B) a bar chart
C) a pie chart
D) a scatter diagram
Correct Answer:
Verified
Q92: THE NEXT QUESTIONS ARE BASED ON THE
Q93: THE NEXT QUESTIONS ARE BASED ON THE
Q94: THE NEXT QUESTIONS ARE BASED ON THE
Q95: THE NEXT QUESTIONS ARE BASED ON THE
Q96: THE NEXT QUESTIONS ARE BASED ON THE
Q98: THE NEXT QUESTIONS ARE BASED ON THE
Q99: One of the standard assumptions of the
Q100: THE NEXT QUESTIONS ARE BASED ON THE
Q101: In general,increasing the variation of x will
Q102: The coefficient of determination is the proportion
Unlock this Answer For Free Now!
View this answer and more for free by performing one of the following actions

Scan the QR code to install the App and get 2 free unlocks

Unlock quizzes for free by uploading documents