
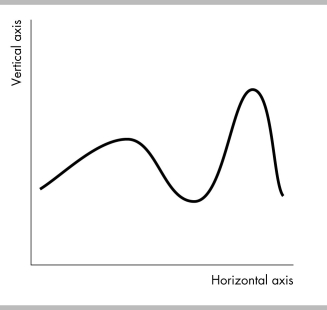
-A time-series graph showing total production in Japan from 1960 to 2010 shows a positive trend. It is the case that total production
A) fell every year between 1960 and 2010.
B) rose every year between 1960 and 2010.
C) was lower in 2010 than in 1960.
D) was higher in 2010 than in 1960.
Correct Answer:
Verified
Q347: The omission of household production causes actual
Q364: A time-series graph reveals whether there is
Q366: Which of the following is CORRECT about
Q367: Q369: A trend is Q373: Q375: A time-series graph displays the price of Q377: Trend refers to Q379: Which type of graph is used to Q380: Unlock this Answer For Free Now! View this answer and more for free by performing one of the following actions Scan the QR code to install the App and get 2 free unlocks Unlock quizzes for free by uploading documents![]()
A) a measure of closeness![]()
A) the scale used on![]()

