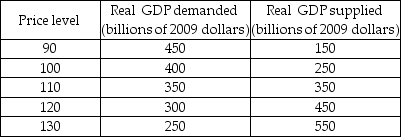
-The table above shows Yellowland's economy aggregate demand and supply schedules. Yellowland's potential GDP is $300 billion.
a) Plot the aggregate demand curve, the short-run aggregate supply curve, and the long-run aggregate supply curve.
b) What are the short-run equilibrium real GDP and price level in Yellowland?
c) What is the long-run equilibrium real GDP?
d) Is Yellowland's short-run macroeconomic equilibrium a full-employment equilibrium, below full-employment equilibrium, or above full-employment equilibrium? What is the recessionary gap (if any)? What is the inflationary gap (if any)?
e) Suppose aggregate supply decreases by $150 billion. Plot the new aggregate supply curve. How do real GDP and the price level change in the short run?
f) Is Yellowland's new short-run macroeconomic equilibrium a full-employment equilibrium, below full-employment equilibrium, or above full-employment equilibrium? What is the recessionary gap (if any)? What is the inflationary gap (if any)?
Correct Answer:
Verified
View Answer
Unlock this answer now
Get Access to more Verified Answers free of charge
Q416: In the short run, a supply shock
Q417: The aggregate demand curve shows total expenditures
Q418: If the money prices of resources changes,
Q419: The level of output at which the
Q420: If the money prices of resources changes,
Q421: A monetarist economist believes that if the
Q422: Fluctuations in aggregate demand and aggregate supply
Unlock this Answer For Free Now!
View this answer and more for free by performing one of the following actions

Scan the QR code to install the App and get 2 free unlocks

Unlock quizzes for free by uploading documents