Multiple Choice
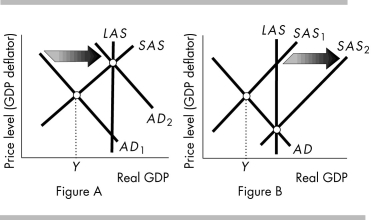
-Which aggregate supply-aggregate demand diagram above shows the effect on real GDP and the price level of monetary policy when it is used to fight a recession?
A) Only Figure A
B) Only Figure B
C) Both Figure A and Figure B
D) Neither Figure A nor Figure B
Correct Answer:
Verified
Related Questions
Q146: In the short run, a rise in
Q147: One problem with the ripple effect from
Q149: In order to combat inflation,the Fed will
Q151: Suppose that initially real GDP equals potential
Unlock this Answer For Free Now!
View this answer and more for free by performing one of the following actions

Scan the QR code to install the App and get 2 free unlocks

Unlock quizzes for free by uploading documents