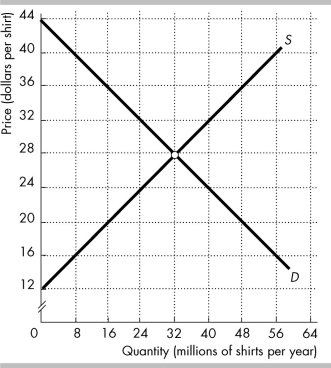
 The figure shows the market for shirts in the United States, where D is the domestic demand curve and S is the domestic supply curve. The world price is $20 per shirt.
-In the figure above, with international trade ________ million shirts per year are produced in the United States.
A) 48
B) 32
C) 16
D) 20
Correct Answer:
Verified
Q14: Based on the table below, at what
Q15: Consider a market that, with no international
Q16: Comparative advantage implies that a country will
A)
Q17: Prior to international trade, if country A
Q18: Consider a market that sells some of
Q20: The fundamental force that drives international trade
Q21: Which of the following statements about U.S.
Q22: The United States has a comparative advantage
Q23: Tariffs and import quotas both result in
A)
Q24: _ gain from exports and _ lose
Unlock this Answer For Free Now!
View this answer and more for free by performing one of the following actions

Scan the QR code to install the App and get 2 free unlocks

Unlock quizzes for free by uploading documents