The graph below plots the escape velocity of each planet along the vertical axis and its surface temperature along the horizontal. The lines plotted in the figure are the average speeds of gas particles as a function of temperature for various gases. Which of the planets or satellite plotted in this diagram has the greatest escape velocity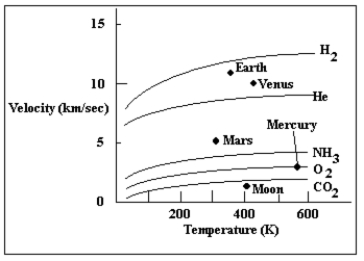
A) Mars
B) the Moon
C) Mercury
D) Venus
E) Earth
Correct Answer:
Verified
Q15: Which of the following are not found
Q16: The moons of Mars are believed to
Q17: The surface of Venus has been studied
A)using
Q18: _ are believed to have formed on
Q19: The greenhouse effect keeps Venus hot because
A)the
Q21: Mercury's major atmospheric gas is
A)oxygen.
B)hydrogen.
C)carbon dioxide.
D)Misleading; the
Q22: Which celestial object in the following graph
Q23: Which one of the phrases below is
Q24: Is the large crater shown on the
Q25: What do astronomers generally believe about the
Unlock this Answer For Free Now!
View this answer and more for free by performing one of the following actions

Scan the QR code to install the App and get 2 free unlocks

Unlock quizzes for free by uploading documents