The graph below plots the escape velocity of each planet along the vertical axis and its surface temperature along the horizontal. The lines plotted in the figure are the average speeds of gas particles as a function of temperature for various gases. Which of the planets or satellite plotted in this diagram is least able to hold an atmosphere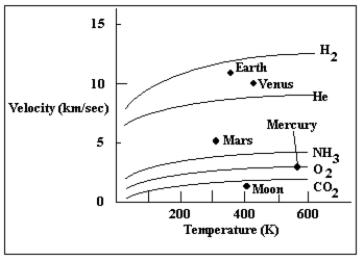
A) Mars
B) the Moon
C) Mercury
D) Venus
E) Earth
Correct Answer:
Verified
Q1: Which of the following supports the idea
Q3: Which of the solar system objects listed
Q4: Mars has a sufficient mass and a
Q5: How rapidly a planet loses its atmosphere
Q6: _ is a very long and deep
Q7: The flow patterns found on the surface
Q8: The graph below plots the escape velocity
Q9: The extreme size of volcanoes on Mars
Q10: The theory that Mercury shrank slightly when
Q11: Coronae on Venus are believed to be
A)impact
Unlock this Answer For Free Now!
View this answer and more for free by performing one of the following actions

Scan the QR code to install the App and get 2 free unlocks

Unlock quizzes for free by uploading documents