Use the following graph for the question.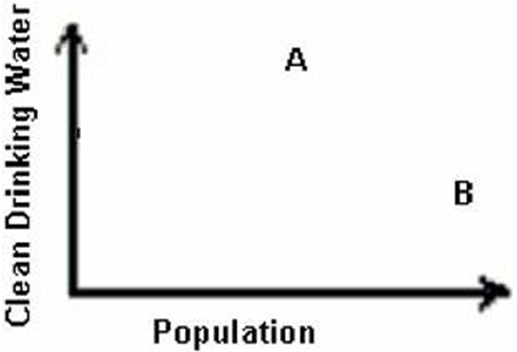
-On the graph of clean drinking water per person, each letter represents a country. Which of the following is most likely?
A) A is the United States; B is India.
B) B is the United States; A is India.
C) A is the United States; B is Canada.
D) B is India; A is China.
E) A is India; B is China
Correct Answer:
Verified
Q4: What would you not find in water
Q10: Withdrawal is the total amount of water
A)lost
Q19: In general, water use in poor countries
Q19: The hydrologic compartment that contains the greatest
Q25: Best available economically achievable technology (BAT) standards
Q26: The city of Arcata,California,is notable because it
Q27: The heating of natural waterways by power
Q29: Coliform bacteria populations are routinely monitored in
Q32: An oligotrophic lake would be very productive.
Q40: Plants that take up heavy metals found
Unlock this Answer For Free Now!
View this answer and more for free by performing one of the following actions

Scan the QR code to install the App and get 2 free unlocks

Unlock quizzes for free by uploading documents