Exhibit 3-10 Demand and supply curves
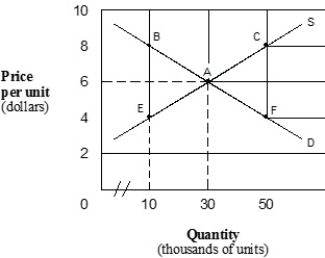
-In Exhibit 3-10, which of the following points represents an excess quantity supplied?
A) Point E.
B) Point B.
C) Point C.
D) Point F.
E) Point A.
Correct Answer:
Verified
Q146: The price of a good will rise
Q261: Exhibit 3-8 Demand and supply data
Q262:
Exhibit 3-7 Demand and supply curves
Q263: When the price of a good
Q264: Exhibit 3-9 Demand and supply curves
Q266: Which of the following is true about
Q267: Exhibit 3-10 Demand and supply curves
Q268: At any price below the equilibrium
Q269: Exhibit 3-9 Demand and supply curves
Q270: Exhibit 3-8 Demand and supply data
Unlock this Answer For Free Now!
View this answer and more for free by performing one of the following actions

Scan the QR code to install the App and get 2 free unlocks

Unlock quizzes for free by uploading documents