Exhibit 3-11 Demand and supply curves
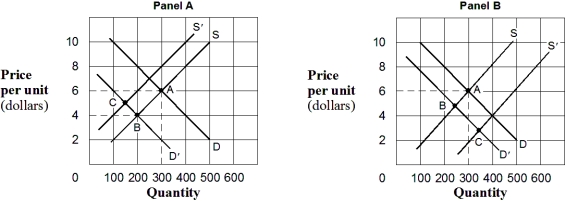
-In Exhibit 3-11,in Panel A the movement from A to B describes a(n) :
A) increase in demand and an increase in the quantity supplied.
B) increase in the quantity demanded and an increase in supply.
C) decrease in demand and a decrease in the quantity supplied.
D) decrease in the quantity demanded and a decrease in supply.
E) decrease in the quantity demanded and an increase in supply.
Correct Answer:
Verified
Q60: Exhibit 3-11 Demand and supply curves
Q142: Q265: Exhibit 3-10 Demand and supply curves Q267: Exhibit 3-10 Demand and supply curves Q281: Exhibit 3-15 Supply and demand curves for Q286: Exhibit 3-15 Supply and demand curves for Q290: Exhibit 3-12 Supply and demand data Q292: Exhibit 3-15 Supply and demand curves for Q293: Exhibit 3-15 Supply and demand curves for Q317: Suppose A and B are complementary goods.![]()
Unlock this Answer For Free Now!
View this answer and more for free by performing one of the following actions

Scan the QR code to install the App and get 2 free unlocks

Unlock quizzes for free by uploading documents