Exhibit 3-13 Supply and demand curves 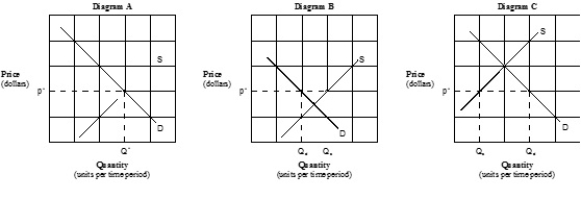
-Which of the graphs in Exhibit 3-13 illustrates a surplus exists at the indicated market price?
A) Diagram A.
B) Diagram B.
C) Diagram C.
D) Diagrams A and C.
Correct Answer:
Verified
Q142: Q295: According to the law of demand, if Q296: Exhibit 3-14 Supply and demand curves Q298: Exhibit 3-16 Supply and demand curves Q299: Exhibit 3-14 Supply and demand curves Q301: If X and Y are substitutes, the Q302: Suppose A and B are substitute goods. Q303: If people buy more of a generic Q304: The law of supply indicates that Q305: If pork and beans is an inferior![]()
Unlock this Answer For Free Now!
View this answer and more for free by performing one of the following actions

Scan the QR code to install the App and get 2 free unlocks

Unlock quizzes for free by uploading documents